In the world of scientific research and communication, it is crucial to convey complex information clearly and effectively. Visual elements such as diagrams, graphs, videos, and infographics not only aid in comprehension but also significantly enhance the citation and impact of scientific articles. With the advancement of artificial intelligence (AI), the creation and integration of visual tools have reached new heights of precision and efficiency. This blog explores the benefits of incorporating visual elements in scientific publications and the emerging role of AI in crafting these elements. Additionally, we will discuss the criteria that journals consider when publishing AI-generated graphics.
Citation Impact: Articles with Graphs and Infographics
The presence of graphs and infographics in scientific articles also plays a significant role in citation performance. A comprehensive analysis by “Nature Communications” found that articles featuring graphs receive on average 20% more citations than their text-only counterparts. The impact is even more pronounced with infographics, which can boost citations by as much as 40%. This is likely because infographics can distill complex datasets into more comprehensible and engaging visual summaries, making the findings more accessible and shareable among researchers. That apart, the visuals make complex data easier to understand for the layman.
The Role of AI in Generating Infographics and Graphical Abstracts
AI is transforming the way infographics and graphical abstracts are produced in scientific publications. With AI algorithms, large volumes of data can be analyzed and visual representations can be automatically generated to highlight significant trends and patterns. This not only saves researchers a lot of time but also ensures that the visuals are accurate, and data-driven. AI tools such as Adobe’s Sensei and Canva’s Magic Visual Suite are increasingly popular among scientists for their ability to quickly create sophisticated and publication-ready graphics. That said, it is vital to understand the importance of human intervention to ensure that the visuals thus created are scientifically and technically sound. At Turacos Healthcare Solutions – A medical communication agency, we not only pioneer in integrating AI into the workspace but also ensure AI and Humans work to enhance quality without compromising on the research integrity.
Journal Criteria for Publishing AI-Generated Graphical Abstracts and Infographics
As AI-generated graphics become more commonplace, journals have begun to establish specific criteria for their inclusion in publications. These criteria typically include:
Accuracy and Relevance: The graphic must accurately represent the data and findings of the article. It should enhance the reader’s understanding of the study rather than merely serving as an aesthetic addition.
Originality and Non-deceptive Design: Graphics must not only be original but also designed in a way that does not mislead the reader. The integrity of data representation is paramount.
Quality and Professionalism: Visuals should meet the professional and technical standards typical of the journal, including resolution, formatting, and aesthetic quality.
Compliance with Ethical Guidelines: AI-generated graphics must adhere to the same ethical standards as other forms of scientific output, particularly regarding data privacy and intellectual property rights.
Source Disclosure: Articles must disclose the use of AI tools in the creation of graphics and ensure that this use complies with the journal’s overall submission guidelines.
We at Turacos Healthcare Solutions – A medical communication agency, ensure all of the above are met and go further in ensuring graphics, diagrams, videos, and infographics created by us are unique and add value to the research manuscript.
Click Here:- Artificial Intelligence, Medical Writers, and Image Integrity in Scientific Publishing
Challenges and Considerations of AI-Generated Graphical Abstracts and Infographics
While AI offers significant advantages in generating graphical abstracts and infographics, it also presents distinct challenges that must be carefully managed. One major concern is the risk of generating inaccurate or misleading visuals due to errors in data input or algorithmic biases. AI systems depend heavily on the data they are trained on, and any inaccuracies or biases in the training data can lead to flawed visual outputs. This is particularly problematic in scientific communication, where precision and accuracy are paramount.
Another issue is the potential loss of originality and creativity in scientific visuals. AI tools may default to generic templates or common visualization formats, potentially stifling innovative ways to present data that could reveal new insights or encourage deeper understanding. The risk of homogenization of scientific visuals could lead to a landscape where distinct data sets are forced into similar visual formats, reducing their impact and the ability to convey unique aspects of the research.
There is also a significant ethical consideration regarding the transparency of AI involvement in the creation of scientific visuals. Journals and researchers must disclose the use of AI tools in their graphical abstracts and infographics. This transparency ensures that the scientific community and readers are aware of the methods behind the data presentation, which is essential for maintaining trust and integrity within scientific publications.
Finally, dependence on AI for graphical representations can diminish skill development in researchers, who may rely on AI tools without fully understanding the underlying principles of good design and accurate data representation. This could potentially weaken the researchers’ ability to critically assess and create effective visuals independently.
Addressing these challenges requires rigorous standards for AI implementation, including thorough validation of AI-generated visuals, clear guidelines for AI use in scientific publications, and continuous education for researchers on the principles of data visualization. As we integrate AI more deeply into the scientific communication process, maintaining a balanced approach that leverages AI’s capabilities while managing its limitations will be crucial for the continued advancement and integrity of scientific discourse.
While diagrams, graphs, videos and infographics significantly enhance the comprehensibility and dissemination of scientific research, it is crucial to maintain a careful balance in the use of AI tools. Ensuring accuracy, fostering creativity, and upholding ethical standards are essential to harness the full potential of visual aids in scientific communication. As we move forward, the integration of AI in scientific visualization must be navigated thoughtfully to enhance, rather than inhibit, the conveyance of scientific knowledge.
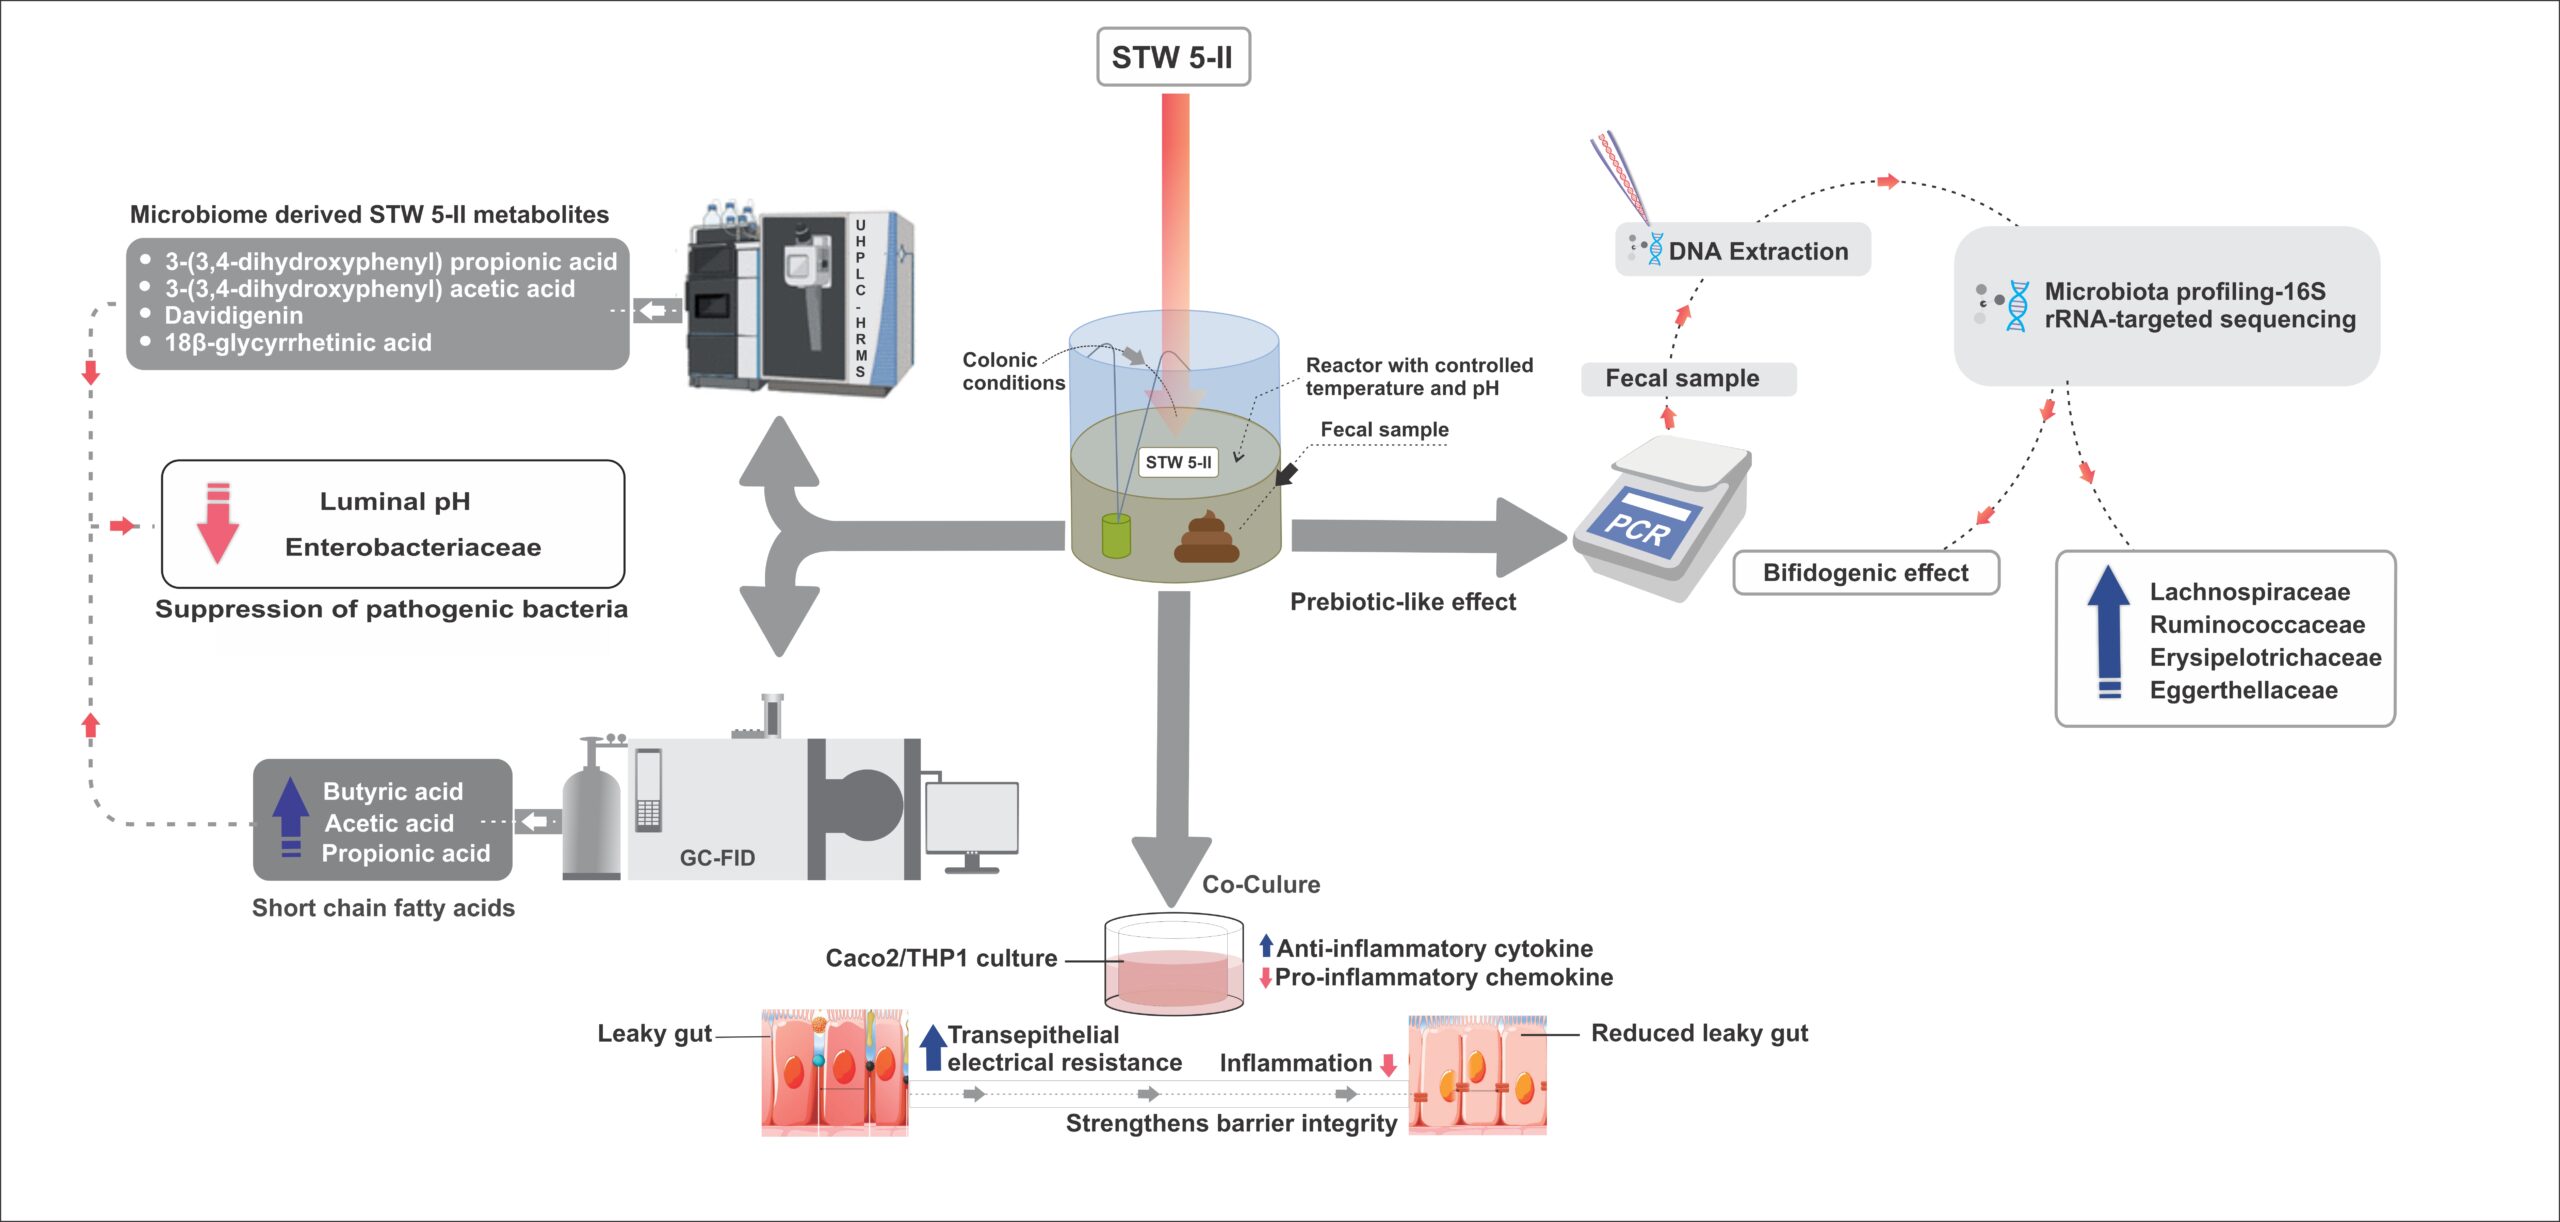
At Turacoz, we strongly believe in the power of technology and human expertise to maintain the highest standards of accuracy, foster creativity, and uphold ethical standards in scientific publishing. Medical writers play an invaluable role in this process, ensuring that every visual not only supports but also enhances the conveyance of scientific knowledge. Here, showcasing our excellent work for a graphical abstract that was published in the Phytomedicine journal.
By addressing the challenges of image integrity head-on, with a combination of skilled human oversight and advanced technological tools, we are setting new standards for accuracy and trust in scientific literature. If you’re interested in learning more about our medical writing services, please feel free to reach out to our team of dedicated professionals at info@turacoz.com. We’ll be more than happy to help you elevate your research, safeguard its integrity, and ensure its lasting contribution to the scientific community.


